

Telnyx Other APIs: Account & Billing — Full Documentation
Complete page content for Account & Billing (Other APIs section) of the Telnyx developer docs (https://developers.telnyx.com). Root index: https://developers.telnyx.com/llms.txt · Lightweight index for this subsection: https://developers.telnyx.com/development/llms/other-apis-account-billing-llms-txt.md
Usage reports
Usage Reports
Source: https://developers.telnyx.com/docs/reporting/usage-reports.md
Overview
The (v2) Usage Reports API is a single endpoint that enables viewing aggregated usage data across all of a customer’s Telnyx products. It is built to be flexible and customizable, so that you have programmatic access to view data in a way that makes sense to your business and use cases. It can be used to efficiently monitor usage trends and costs, as well as to directly integrate with your internal systems.Query Requirements
Products
A product from the Options response (see next section) must be included. At this time, there is not a way to view usage for all or multiple products at once. Products Supported:- Sip-Trunking (sip-trunking)
- Messaging (messaging)
- Voice API (call-control)
- Wireless (wireless)
- Cloud Storage (cloud-storage)
- Inference (inference)
- Verify 2fa (verify-2fa)
- Fax API (fax-api)
- WebRTC (webrtc)
- Calls per Second (cps)
- Conference (conference)
- Video API (programmable-video)
- Call Control Features (call-control-features)
- Customer Service Record (customer-service-record)
- Media Streaming (media-streaming)
- Noise Suppression (noise-suppression)
- Text to Speech (text-to-speech)
- Speech to Text (speech-to-text)
- Recording (recording)
- Forking (forking)
- Media Storage (media-storage)
- Answering Machine Detection (amd)
Dates
The start and end date parameters should be in the formatYYYY-MM-DDThh:mm:ssTZD (eg 2022-12-24T19:20:30-05:00). This allows you to specify the timespan in your local time by including the timezone offset. The start_date parameter is inclusive, while the end_date parameter is exclusive - e.g. if you wanted data for all of February, the start_date would be 2023-02-01T00:00:00-00:00 and the end_date would be 2023-03-01T00:00:00-00:00. Billing usage is calculated using UTC. The maximum range supported is 31 days.
Another way to specify the timespan you want is to utilize the date literals spelled out in our developer docs - https://developers.telnyx.com/api#date-literals. This can be achieved by replacing start_date & end_date with date_range like this: date_range=last_1_weeks.
To see the requested data broken out by day for the timespan selected, there is a date dimension available on all products. Additionally, there’s a breakout by hour available using the date_time dimension.
Format
Specifying a format is optional. The endpoint returns JSON by default. At this time, the API also supports generating a CSV file from the response by specifyingformat=csv in your query.
Dimensions & Metrics Options Per Product
To view the products with their dimensions and metrics available for reporting, you can make a request to the endpoint below. Metrics are the values you’re interested in, for example, the number of calls attempted or the total cost of your usage. Dimensions are how you want your data broken out, for example, by connection, messaging profile, or the traffic’s direction. Below, you’ll see a sample of the “Options” response for Sip-Trunking. If you already know the product you want and are looking for only its supported dimensions/metrics, you can pass the product parameter as shown in the example. If you want to see all products, simply leave off the product parameter.Request:
Don’t forget to updateYOUR_API_KEY here.
Response:
Product Examples
SIP Trunking
Example 1: Simple SIP Report
Let’s say we’re interested in our sip-trunking usage for the week of January 23rd. And let’s say we want to see the total calls connected versus calls attempted and the total cost. And we need these numbers broken out by direction and country. We first make a query to the Options endpoint listed above to make sure those requirements are all supported and to see how to query for them. These are our requirements shown next to how we’d construct our query for them: Product: sip-trunking product=sip-trunking Date(s): January 23rd - 28th 2024 start_date=2024-01-23T00:00:00-00:00end_date=2024-01-29T00:00:00-00:00 Metrics: calls connected, calls attempted, cotal cost metrics=connected,attempted,cost Broken out by destination countryNote: Since we’re filtering on the direction, we must include it. dimensions=country_code,direction Outbound only filter[direction]=outbound API Response’s Page Size/Number page[number]=1page[size]=20Request:
Response:
From the response below, we can see that during the week in question, our account only had traffic to the US (country code = 1). Our connected versus attempted is 883,930 vs 1,245,811 calls respectively. And the total cost for those outbound calls was 1911.624 (Note: If you had wanted the currency, that is another dimension that can be added in the query withdimensions=currency).
Example 2: Short Duration Calls
Telnyx enforces automatic surcharges for customer accounts whose short duration calls (greater than 0 and less than or equal to 6 seconds) total 15% or more of their outbound traffic. As someone running SIP traffic, I may want to know if I’m in danger of receiving the surcharge at the end of the month. We have exposed a metric solely for the purpose of this calculation. Product: sip-trunking product=sip-trunking Date(s): January 2024 start_date=2024-01-01T00:00:00-00:00end_date=2024-02-01T00:00:00-00:00 Metrics: calls completed metrics=completed Broken out by SDC (short duration call: true or false)Note: Since we’re filtering on the direction, we must include it. dimensions=short_duration_call,direction Outbound only filter[direction]=outbound API Response’s Page Size/Number page[number]=1page[size]=20Request:
Response:
From the response below, we can determine the percentage of our traffic that is currently considered short duration:414515 / (414515 + 522094) = 44%. If we wanted to take this a step further, we could see which connections are the biggest offenders by adding “connection_id” to the dimensions list.
Messaging
Example 1: Simple Messaging Report
In this example, we’ll put together a simple request to view our Messaging usage for a single day. Product: messaging product=messaging Date(s): Today date_range=today Metrics: total cost, total messages sent, total message parts metrics=cost,count,parts Broken out by CarrierNote: Since we’re filtering on the direction, we must include it. dimensions=short_duration_call,direction Outbound only filter[direction]=outbound API Response’s Page Size/Number page[number]=1page[size]=20Request:
Response (abbreviated):
Example 2: Alphanumeric by MNC/MCC
This example is a little more complex, and lays out a monthly Messaging report of our Alphanumeric traffic per country, broken out by MCC (Mobile Country Code) and MNC (Mobile Network Code). Product: messaging product=messaging Date(s): January 2024 start_date=2024-01-01T00:00:00-00:00end_date=2024-02-01T00:00:00-00:00 Metrics: total cost, total message parts metrics=cost,parts Dimensions: mcc, mnc, destination country, status_v2 dimensions=direction,mcc,mnc,country_iso,product_name,status_v2 Filters: alphanumeric, outbound, billable statuses only filter[product_name]=alphanumeric_idfilter[direction]=outboundfilter[status_v2]=deliveredfilter[status_v2]=delivery_failedfilter[status_v2]=delivery_unconfirmedRequest:
Response (abbreviated):
Session analysis
Session Analysis
Source: https://developers.telnyx.com/docs/reporting/session-analysis.md
Session Analysis API Usage Guide
Understand the full cost and event tree for any Telnyx AI or voice session — from a single inference call to complex multi-product conversations.What is Session Analysis?
Session Analysis gives you a complete view of costs and events for any usage session on the Telnyx platform:- Full event tree — parent events, child events, and their relationships
- Rollup costs — per-event costs plus cumulative totals across the session
- Product linkages — how different Telnyx products interacted in a single session
When to Use It
Core Concepts
Record Types
A record type identifies the category of usage event for a Telnyx product. Each record type maps to a specific product and has defined relationships to other record types. Example:ai-voice-assistant is the record type for AI Voice Assistant sessions, which have inference events as children.
Sessions
A session is a tree of related usage events. The root event is the primary event you’re analyzing. Child events are related usage that occurred as part of that session. Example: An AI Voice Assistant call involves acall-session root with a call-control child, which in turn has an ai-voice-assistant child with inference events underneath — each representing one LLM turn in the conversation.
Relationships
Events are connected via relationships:
Relationships are defined via field mappings — the child’s
local_field matches the parent’s parent_field. For example, inference events link to their ai-voice-assistant parent via the conversation_id field.
Cost Rollup
Each event node includes:event_cost— Cost of this individual eventcumulative_cost— This event’s cost plus all descendant costs
cumulative_cost equals the total session cost. For AI sessions, this means the call-session cumulative cost includes everything — the AI assistant, each inference turn, STT, TTS, call control, and SIP trunking — rolled up into one number.
Endpoints
1. List All Record Types
record_types[]— Array of all record types with their parent/child relationshipsquery_parameters— Valid parameters for session analysis queriesmeta— Total count and last updated timestamp
2. Get Record Type Details
- Valid child and parent relationships
- Example query URLs
- Recommended max depth for traversal
3. Get Session Analysis
You can find event IDs in the individual webhooks or detail records for the applicable event.
Which record type should I use? If you’re analyzing a call made with your AI assistant, start with
call-session. This gives you the full picture — AI assistant sessions, inference events, call control, SIP trunking, and all other products in one tree. Use the metadata endpoint to explore other starting points for different products.
Query Parameters:
Example:
Response Structure
Top-Level Fields
Event Node Structure
Each event in the tree follows this structure:Relationship Object
For child events, therelationship field explains the connection:
Note: The
via fields vary by relationship. AI-related linkages often use conversation_id, while voice/telephony relationships typically use telnyx_session_id or call_session_id.
Example: AI Voice Assistant Session
A customer makes an inbound call to an AI Voice Assistant using the Telnyx Web Dialer. The assistant handles a multi-turn conversation over ~152 seconds. Query:
Key observations:
- The call-session root has $0.00 event cost — it’s a container for the session, not a billable event itself.
- ai-voice-assistant is the dominant cost at 0.06/min for 3 billed minutes). Its cumulative cost of $0.1921 includes 5 inference events underneath.
- Each inference event represents a single LLM call during the conversation — one per assistant turn. The cost per turn varies based on the model and token count.
- call-control has a 0.1973 cumulative cost — the difference is the ai-voice-assistant subtree rolling up underneath it.
- recording, webrtc, and sip-trunking are leaf nodes with no children, so their event cost equals their cumulative cost.
Understanding the AI Cost Structure
In an AI-powered call, costs come from multiple layers:
Session Analysis rolls all of these into one tree, so you can see exactly where cost accumulates — whether it’s the AI assistant minute rate, the number of inference turns, or the underlying voice transport.
Common Use Cases
Debugging High-Cost AI Sessions
- Query the session with
max_depth=5to get the full tree - Look at
meta.productsto see which products were involved - Compare
event_costacross children — ifai-voice-assistantis the driver, check how many inference turns occurred underneath - Check
recordfields for rate information (rate,rate_measured_in) and duration
Finding Related Events
- Start from any event in the tree
- Use
relationship.viato understand the field linkage - Query the parent or children directly using their
id
Exporting for Analysis
- Use
expand=noneto get just the tree structure without full records - Flatten the tree programmatically for spreadsheet import
- Or keep full records and parse specific fields (e.g.,
rate,duration_sec)
Best Practices
Performance
- Provide
date_timewhen you know it — this narrows the index search and improves response time - Use appropriate
max_depth— start with2, increase only if needed. AI sessions with inference events typically needmax_depth=4or5to reach the leaf level. - Use
expand=noneif you only need cost rollups, not full records
Querying
- Start from the root event — the most complete picture comes from the top-level event
- Check metadata first —
/metadata/{record_type}shows expected children and recommended depth - Use
links.recordsto get the underlying detail records for deeper analysis
Error Handling
Record Types Reference
AI & Voice Intelligence
Voice & Telephony
Media & Storage
Conferencing
Messaging
Video
Other Products
On-Demand Reports
On-Demand Reports
Source: https://developers.telnyx.com/docs/reporting/on-demand-reports.mdOn-Demand Reports lets you query your Telnyx usage data using natural language. Instead of building filters and exporting CSVs, describe the report you want in plain English and the system generates it.
Overview
On-Demand Reports uses AI to translate natural language into structured queries against your Usage Report data. You can request specific chart types, date ranges, groupings, and breakdowns — all from a single text input.Getting started
- Log in to the Mission Control Portal.
- Navigate to Reporting > On-Demand Reports.
- Type a query describing the report you need and submit it.
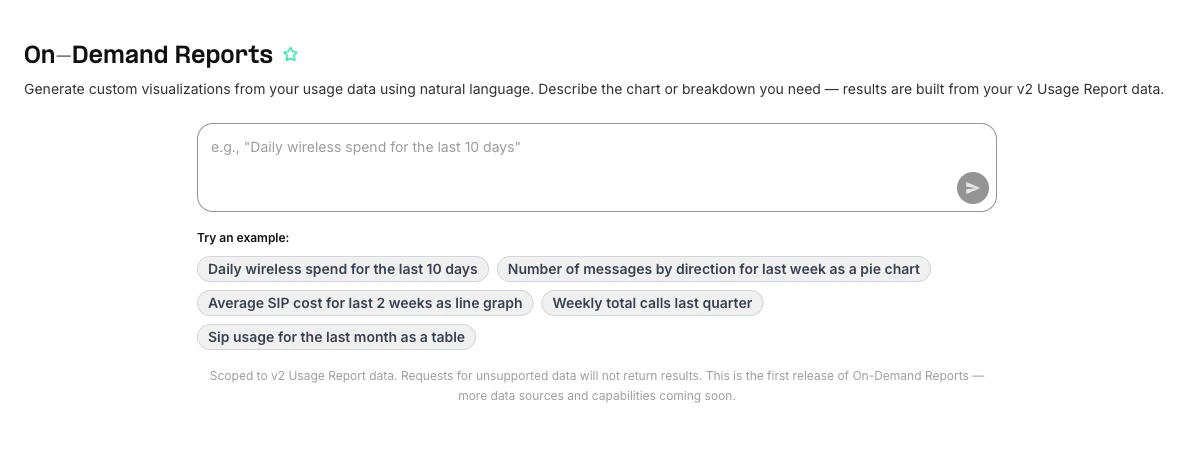
Example queries
- “Daily wireless spend for the last 10 days”
- “Number of messages by direction for last week as a pie chart”
- “Weekly total calls last quarter”
- “Average SIP cost for last 2 weeks as line graph”
- “SIP usage for the last month as a table”
What you can do
Current limitations
- Queries run against v2 Usage Report data only. Products and dimensions available in Usage Reports are available here.
- Not a general knowledge assistant — the system answers questions about your Telnyx usage data, not general questions.
- This is the first release. Coverage and capabilities will expand over time.
API Reference (Account & Billing)
AutoRechargePreferences
- List auto recharge preferences: Returns the payment auto recharge preferences.
- Update auto recharge preferences: Update payment auto recharge preferences.
Notifications
- List notification channels: List notification channels.
- Create a notification channel: Create a notification channel.
- Get a notification channel: Get a notification channel.
- Update a notification channel: Update a notification channel.
- Delete a notification channel: Delete a notification channel.
- List all Notifications Events Conditions: Returns a list of your notifications events conditions.
- List all Notifications Events: Returns a list of your notifications events.
- List all Notifications Profiles: Returns a list of your notifications profiles.
- Create a notification profile: Create a notification profile.
- Get a notification profile: Get a notification profile.
- Update a notification profile: Update a notification profile.
- Delete a notification profile: Delete a notification profile.
- List notification settings: List notification settings.
- Add a Notification Setting: Add a notification setting.
- Get a notification setting: Get a notification setting.
- Delete a notification setting: Delete a notification setting.
Addresses
- List all addresses: Returns a list of your addresses.
- Creates an address: Creates an address.
- Retrieve an address: Retrieves the details of an existing address.
- Deletes an address: Deletes an existing address.
- Accepts this address suggestion as a new emergency address for Operator Connect and finishes the uploads of the numbers associated with it to Microsoft.
- Validate an address: Validates an address for emergency services.
Billing
Authentication Providers
- List all SSO authentication providers: Returns a list of your SSO authentication providers.
- Creates an authentication provider: Creates an authentication provider.
- Retrieve an authentication provider: Retrieves the details of an existing authentication provider.
- Update an authentication provider: Updates settings of an existing authentication provider.
- Deletes an authentication provider: Deletes an existing authentication provider.
IP Addresses
- List all Access IP Addresses
- Create new Access IP Address
- Retrieve an access IP address
- Delete access IP address
IP Ranges
Managed Accounts
- Lists accounts managed by the current user.: Lists the accounts managed by the current user. Users need to be explictly approved by Telnyx in order to become manager accounts.
- Create a new managed account.: Create a new managed account owned by the authenticated user. You need to be explictly approved by Telnyx in order to become a manager account.
- Retrieve a managed account: Retrieves the details of a single managed account.
- Update a managed account: Update a single managed account.
- Disables a managed account: Disables a managed account, forbidding it to use Telnyx services, including sending or receiving phone calls and SMS messages. Ongoing phone calls will not be…
- Enables a managed account: Enables a managed account and its sub-users to use Telnyx services.
- Update the amount of allocatable global outbound channels allocated to a specific managed account.: Update the amount of allocatable global outbound channels allocated to a specific managed account.
- Display information about allocatable global outbound channels for the current user.: Display information about allocatable global outbound channels for the current user. Only usable by account managers.
Organization Users
- List organization users: Returns a list of the users in your organization.
- Get organization user: Returns a user in your organization.
- Delete organization user: Deletes a user in your organization.
- Get organization users groups report: Returns a report of all users in your organization with their group memberships. This endpoint returns all users without pagination and always includes group i…
Billing Groups
- List all billing groups
- Create a billing group
- Get a billing group
- Update a billing group
- Delete a billing group
Detail Records
- Search detail records: Search for any detail record across the Telnyx Platform
MDR Detailed Reports
- Get all MDR detailed report requests: Retrieves all MDR detailed report requests for the authenticated user
- Create a new MDR detailed report request: Creates a new MDR detailed report request with the specified filters
- Get a specific MDR detailed report request: Retrieves a specific MDR detailed report request by ID
- Delete a MDR detailed report request: Deletes a specific MDR detailed report request by ID
CDR Reports
- Get all CDR report requests: Retrieves all CDR report requests for the authenticated user
- Create a new CDR report request: Creates a new CDR report request with the specified filters
- Get a specific CDR report request: Retrieves a specific CDR report request by ID
- Delete a CDR report request: Deletes a specific CDR report request by ID
- Get available CDR report fields: Retrieves all available fields that can be used in CDR reports
MDR Usage Reports
- List MDR usage reports: Fetch all previous requests for MDR usage reports.
- Create a new legacy usage V2 MDR report request: Creates a new legacy usage V2 MDR report request with the specified filters
- Get an MDR usage report: Fetch single MDR usage report by id.
- Delete a V2 legacy usage MDR report request: Deletes a specific V2 legacy usage MDR report request by ID
- Fetch all Messaging usage reports: Fetch all messaging usage reports. Usage reports are aggregated messaging data for specified time period and breakdown
- Create MDR Usage Report: Submit request for new new messaging usage report. This endpoint will pull and aggregate messaging data in specified time period.
- Retrieve messaging report: Fetch a single messaging usage report by id
- Delete MDR Usage Report: Delete messaging usage report by id
- Generate and fetch MDR Usage Report: Generate and fetch messaging usage report synchronously. This endpoint will both generate and fetch the messaging report over a specified time period. No polli…
Telco Data Usage Reports
- List telco data usage reports: Retrieve a paginated list of telco data usage reports
- Submit telco data usage report: Submit a new telco data usage report
- Get telco data usage report by ID: Retrieve a specific telco data usage report by its ID
- Delete telco data usage report: Delete a specific telco data usage report by its ID
Speech to text Usage Reports
- Get speech to text usage report: Generate and fetch speech to text usage report synchronously. This endpoint will both generate and fetch the speech to text report over a specified time period.
CDR Usage Reports
- List CDR usage reports: Fetch all previous requests for cdr usage reports.
- Create a new legacy usage V2 CDR report request: Creates a new legacy usage V2 CDR report request with the specified filters
- Get a CDR usage report: Fetch single cdr usage report by id.
- Delete a V2 legacy usage CDR report request: Deletes a specific V2 legacy usage CDR report request by ID
- Generates and fetches CDR Usage Reports: Generate and fetch voice usage report synchronously. This endpoint will both generate and fetch the voice report over a specified time period. No polling is ne…
Usage Reports (BETA)
- Get Telnyx product usage data (BETA): Get Telnyx usage data by product, broken out by the specified dimensions
- Get Usage Reports query options (BETA): Get the Usage Reports options for querying usage, including the products available and their respective metrics and dimensions
Speech to Text Batch Reports
- Get all Speech to Text batch report requests: Retrieves all Speech to Text batch report requests for the authenticated user
- Create a new Speech to Text batch report request: Creates a new Speech to Text batch report request with the specified filters
- Get a specific Speech to Text batch report request: Retrieves a specific Speech to Text batch report request by ID
- Delete a Speech to Text batch report request: Deletes a specific Speech to Text batch report request by ID
MDR Detail Reports
- Fetch all Mdr records: Fetch all Mdr records
WDR Detail Reports
- Fetches all Wdr records: Fetch all Wdr records
Session Analysis
- Get metadata overview: Returns all available record types and supported query parameters for session analysis.
- Get record type metadata: Returns detailed metadata for a specific record type, including relationships and examples.
- Get session analysis: Retrieves a full session analysis tree for a given event, including costs, child events, and product linkages.
Webhooks
- List webhook deliveries: Lists webhook_deliveries for the authenticated user
- Find webhook_delivery details by ID: Provides webhook_delivery debug data, such as timestamps, delivery status and attempts.
Audit Logs
- List Audit Logs: Retrieve a list of audit log entries. Audit logs are a best-effort, eventually consistent record of significant account-related changes.
User Tags
- List User Tags: List all user tags.
UserAddresses
- List all user addresses: Returns a list of your user addresses.
- Creates a user address: Creates a user address.
- Retrieve a user address: Retrieves the details of an existing user address.
Integration Secrets
- List integration secrets: Retrieve a list of all integration secrets configured by the user.
- Create a secret: Create a new secret with an associated identifier that can be used to securely integrate with other services.
- Delete an integration secret: Delete an integration secret given its ID.