Overview
On-Demand Reports uses AI to translate natural language into structured queries against your Usage Report data. You can request specific chart types, date ranges, groupings, and breakdowns — all from a single text input.Getting started
- Log in to the Mission Control Portal.
- Navigate to Reporting > On-Demand Reports.
- Type a query describing the report you need and submit it.
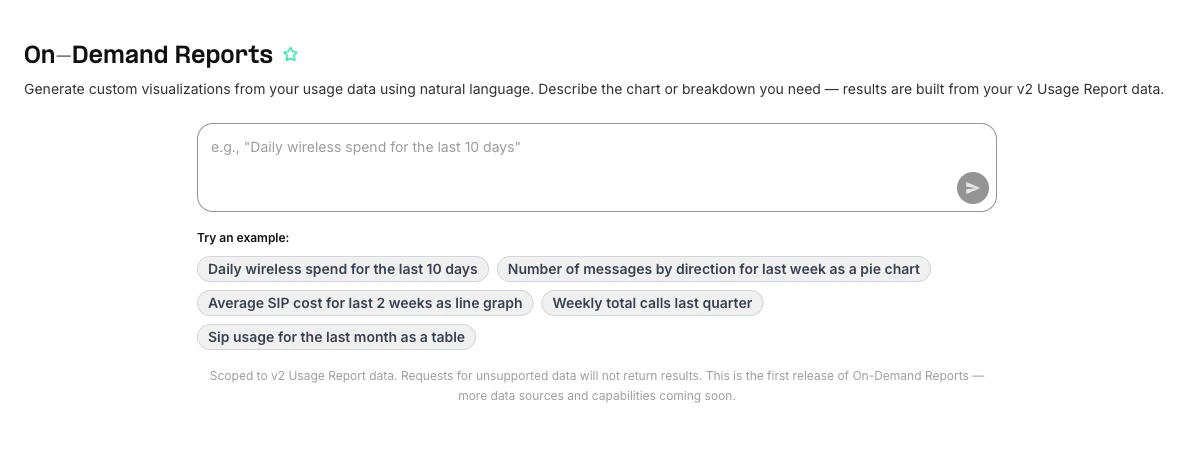
Example queries
- “Daily wireless spend for the last 10 days”
- “Number of messages by direction for last week as a pie chart”
- “Weekly total calls last quarter”
- “Average SIP cost for last 2 weeks as line graph”
- “SIP usage for the last month as a table”
What you can do
Current limitations
- Queries run against v2 Usage Report data only. Products and dimensions available in Usage Reports are available here.
- Not a general knowledge assistant — the system answers questions about your Telnyx usage data, not general questions.
- This is the first release. Coverage and capabilities will expand over time.