WebRTC Voice SDKs Debug Data
This is a beta feature. The data schema and presentation may change without notice.
Availability
Enabling Debug
Initialize the SDK client with debug set totrue and output set to socket.
Locating the Debug Data
When properly enabled, the SDK client will ship debug data frames to Telnyx over the websocket. The data frames are assembled into a singlejson file and stored in a Telnyx Cloud Storage bucket located in us-central-1 belonging to the user.
The bucket is named voice-sdk-debug-reports-[USER-ID] where USER-ID is the user’s account ID.
The objects are named following this schema [call_id]/rtc_stats_reports/[segment_id] where call_id is the ID identifying the call leg between the SDK client and Telnyx. In most cases, there is only one data segment. When there is a reconnect between the SDK client and Telnyx, there may be more than one data segment.
To illustrate the above point more concretely, consider this example:
- A call is made from a JS SDK client to a phone number.
- The WebRTC call record is located using the detail record API.
- Noting the
call_id, locate the data using Telnyx Mission Control portal or a properly configured AWS CLI.
prefix is the call_id.
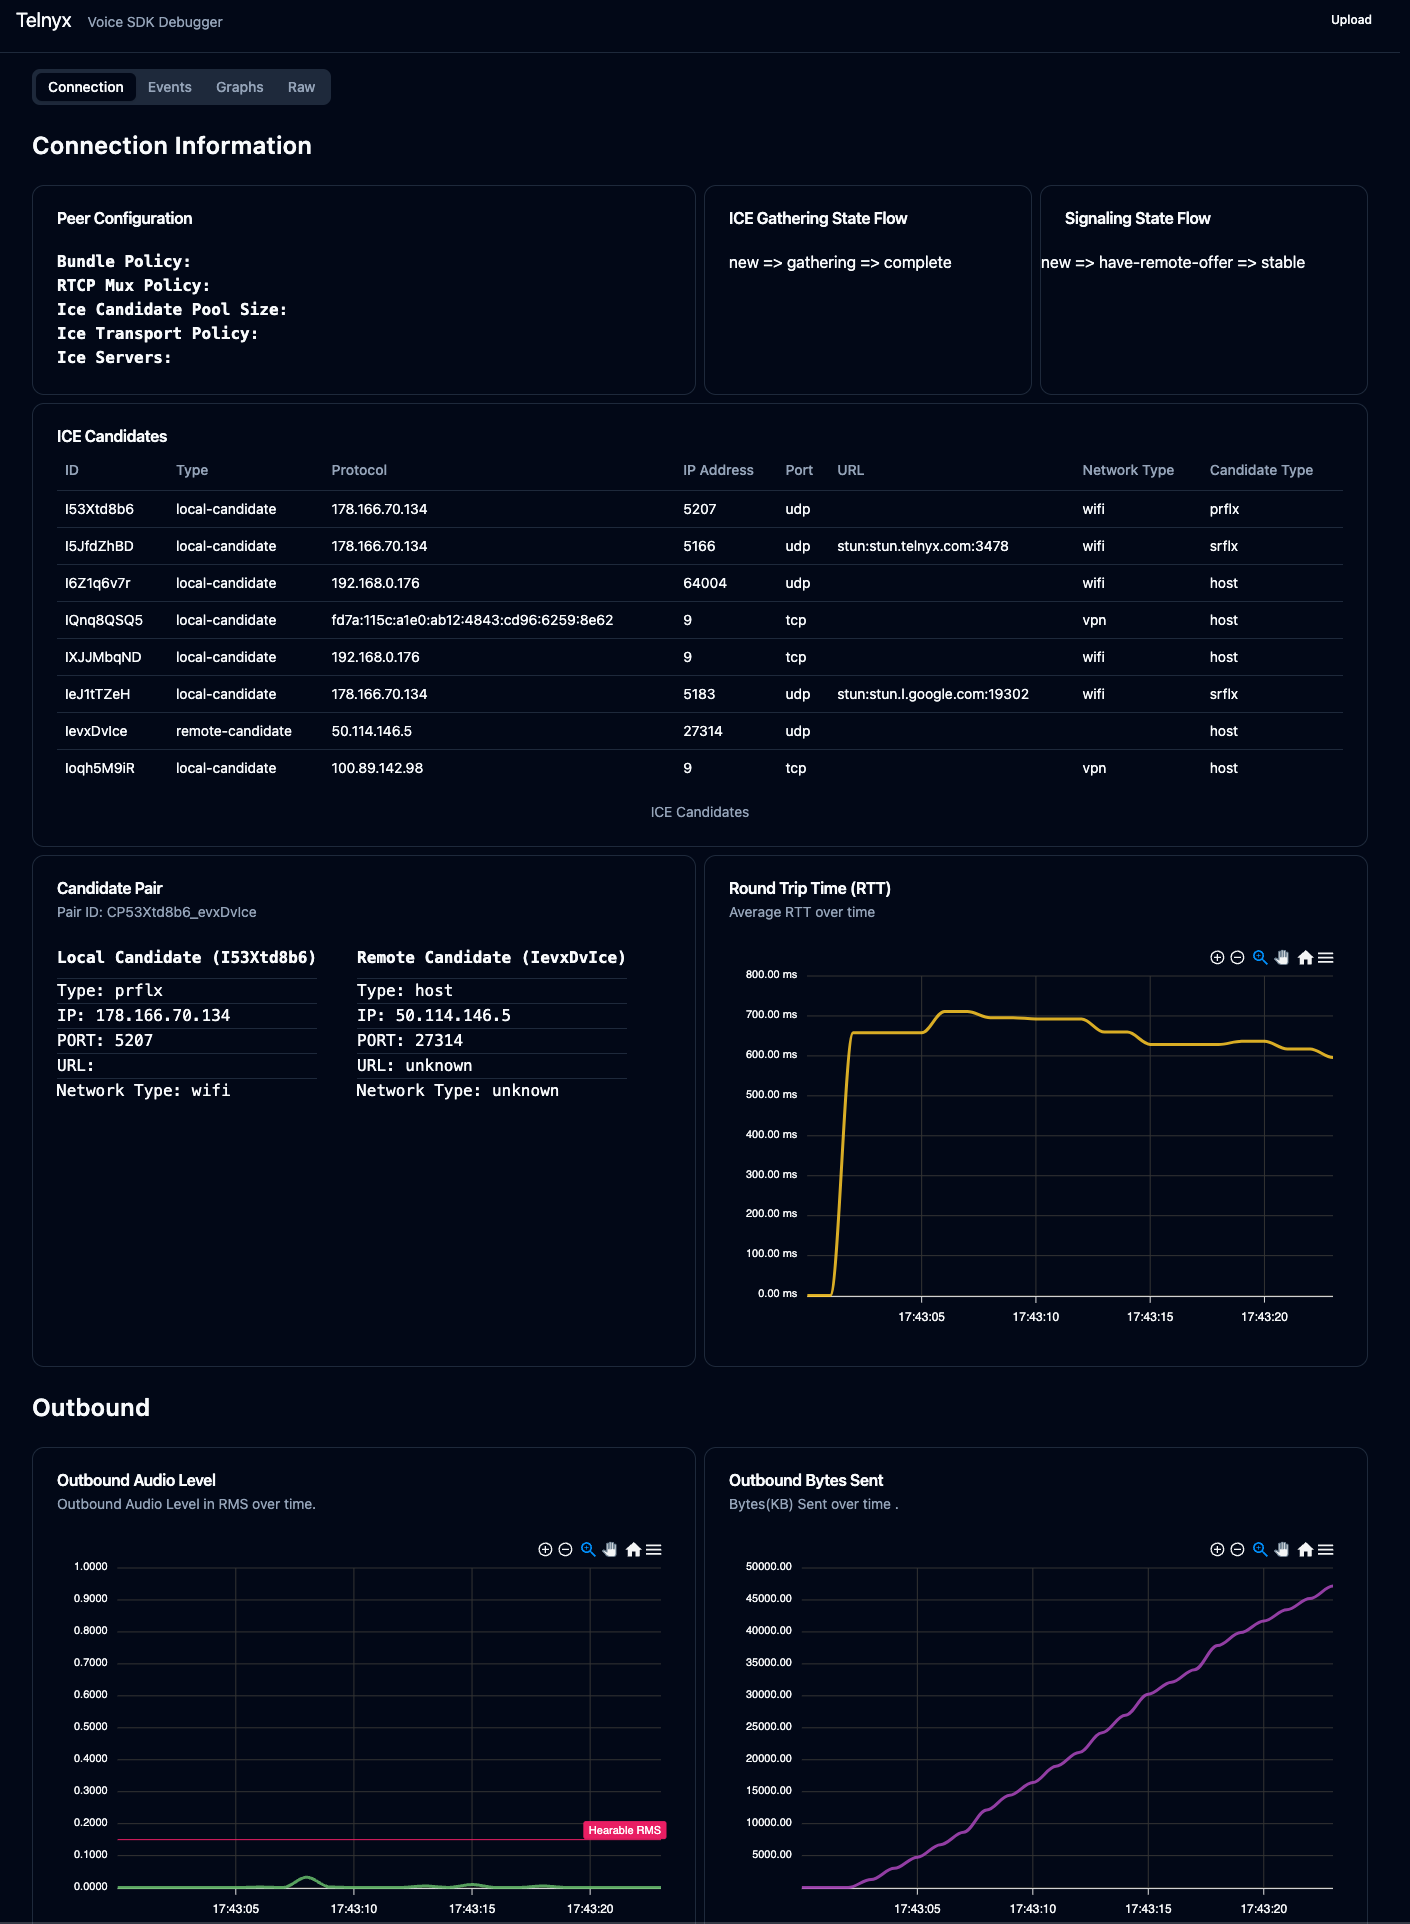
Visualizing the Data
The data can be uploaded and visualized via https://webrtc-debug.telnyx.com/.